Market Outlook
September 29, 2017
Market Cues
Domestic Indices
Chg (%)
(Pts)
(Close)
Indian markets are likely to open in flat tracking global indices and SGX Nifty.
BSE Sensex
0.4
123
31,282
U.S. markets had a lacklustre trading session during Thursday and remained largely
Nifty
0.3
33
9,769
remained range bound, finally closing the day with a flat note. The markets
Mid Cap
0.8
117
15,309
remained range bound despite President Donald Trumps call for tax reforms. The
president intends to reduce tax for corporate as well as personal income tax.
Small Cap
0.9
142
15,940
Bankex
0.8
207
26,986
The European markets also remained range bound during the day and. The markets
however reacted positively to banking and retail stocks on the news of US federal
Global Indices
Chg (%)
(Pts)
(Close)
reserves call for rate hike and a better result from H&M.
Dow Jones
0.2
140
22,381
After sharp correction in the markets over the last few trading session the Indian
Nasdaq
0.0
50
6,453
indices witnessed some bounce back today on the day of F&O expiry. Selective
FTSE
0.1
9
7,323
pharma and cement stocks witnessed buying interest. However, the broader mood
Nikkei
(0.3)
(71)
20,292
in the market remains cautious as worry over fiscal slippages and weak rupee
Hang Seng
0.2
262
27,484
persists among investors and traders.
Shanghai Com
0.4
14
3,354
News Analysis
L&T may sell some power and road projects
Advances / Declines
BSE
NSE
Detailed analysis is on Pg2
Advances
1,535
1,019
Declines
1,995
648
Investor’s Ready Reckoner
Unchanged
163
82
Key Domestic & Global Indicators
Stock Watch: Latest investment recommendations on 150+ stocks
Volumes (` Cr)
Refer Pg7 onwards
BSE#
3,147
Top Picks
NSE
38,255
CMP
Target
Upside
Company
Sector
Rating
(`)
(`)
(%)
Blue Star
Capital Goods Accumulate
751
850
13.2
#Net Inflows (` Cr)
Net
Mtd
Ytd
Dewan Housing FinanceFinancials
Accumulate
534
610
14.2
FII
(5(518)
(2(7,158)
440,130
Asian Granito
Others
Buy
467
570
22.0
MFs
1,424
411,818
180,704
Navkar Corporation
Others
Buy
182
265
45.8
KEI Industries
Capital Goods
Buy
319
371
16.3
More Top Picks on Pg5
Top Gainers
Price (`)
Chg (%)
Adanitrans
147
8.7
Key Upcoming Events
Gdl
233
8.3
Previous
Consensus
Date
Region
Event Description
Reading
Expectations
Irb
223
7.8
Sep 29, 2017 US
GDP Qoq (Annualised)
3.00
3.00
Cyient
520
7.1
Sep 29, 2017 UK
GDP (YoY)
1.70
1.70
Jpassociat
17
6.8
Sep 30, 2017 UK
PMI Manufacturing
56.90
56.20
Oct02, 2017 China
PMI Manufacturing
51.70
51.60
Oct02, 2017 Germany PMI Manufacturing
60.60
Top Losers
Price (`)
Chg (%)
More Events on Pg7
Bomdyeing
168
(5.0)
Fretail
509
(3.8)
Pcjeweller
318
(3.2)
Balramchin
158
(3.1)
Ramcocem
670
(2.9)
#as on 28th Sep, 2017
Market Outlook
September 29, 2017
News Analysis
L&T may sell some power and road projects
L&T the engineering major intends to divest some of its roads and power projects
as it focuses on its core business. According to the plan these projects which
generates less than `1000cr revenues and many of them are loss making and
hence would like to exit. The company has already sold off its two ports one in
Dhamara in Odisha and Katupalli in Tamilnadu. L&T’s portfolio includes 15 road
projects with project cost of `16,100cr and two power projects with capacity of
1499 MW and project cost of `11,200 cr. Exiting the noncore assets will reduce
the working capital of the company and reduce the debt as well. While the
company will also end up losing some revenues net it could be margin accretive
for the company.
Economic and Political News
Govt allows airlines to user bigger planes, eases rules on connecting flights,
under the UDAN flights
GE locomotive plant in Bihar on track, says Railway minister
Truck sales seen slowing in from November as demand stagnates
Corporate News
Sun Pharma and Dr Reddy’s line up new drugs amid price war
M&M, Tata Motors, Nissan bid for India’s first electric car tender
Market Outlook
September 29, 2017
Top Picks
Market Cap
CMP
Target
Upside
Company
Rationale
(` Cr)
(`)
(`)
(%)
Strong growth in domestic business due to its leadership
in acute therapeutic segment. Alkem expects to launch
Alkem Laboratories
22,298
1,865
2,079
11.5
more products in USA, which bodes for its international
business.
We expect the company would report strong profitability
Asian Granito
1,405
467
570
22.0
owing to better product mix, higher B2C sales and
amalgamation synergy.
Favorable outlook for the AC industry to augur well for
Cooling products business which is out pacing the
Blue Star
7,191
751
850
13.2
market growth. EMPPAC division's profitability to
improve once operating environment turns around.
With a focus on the low and medium income (LMI)
consumer segment, the company has increased its
Dewan Housing Finance
16,755
534
610
14.2
presence in tier-II & III cities where the growth
opportunity is immense.
Loan growth is likely to pick up after a sluggish FY17.
Lower credit cost will help in strong bottom-line growth.
Karur Vysya Bank
8,633
143
180
26.0
Increasing share of CASA will help in NIM
improvement.
High order book execution in EPC segment, rising B2C
KEI Industries
2,481
319
371
16.3
sales and higher exports to boost the revenues and
profitability
Expected to benefit from the lower capex requirement
Music Broadcast
2,148
377
434
15.3
and 15 year long radio broadcast licensing.
Massive capacity expansion along with rail advantage
Navkar Corporation
2,593
182
265
45.8
at ICD as well CFS augurs well for the company
Strong brands and distribution network would boost
Siyaram Silk Mills
1,984
2,117
2,500
18.1
growth going ahead. Stock currently trades at an
inexpensive valuation.
Market leadership in Hindi news genre and no.
2
viewership ranking in English news genre, exit from the
TV Today Network
2,095
351
435
23.8
radio business, and anticipated growth in ad spends by
corporates to benefit the stock.
After GST, the company is expected to see higher
volumes along with improving product mix. The Gujarat
Maruti Suzuki
2,38,557
7,897
8,658
9.6
plant will also enable higher operating leverage which
will be margin accretive.
We expect loan book to grow at 24.3% over next two
GIC Housing
2,791
518
655
26.4
year; change in borrowing mix will help in NIM
improvement..
Source: Company, Angel Research
Market Outlook
September 29, 2017
Key Upcoming Events
Global economic events release calendar
Bl oomberg Data
D ate
Time
C ountry
Event Description
Unit
Period
L ast Reporte d
E stimate d
Sep 29, 2017
6:00 PM US
GDP Qoq (Annualise d)
% Change
2Q T
3.00
3.00
2:00 PM UK
GDP (YoY)
% Change
2Q F
1.70
1.70
Sep 30, 2017
2:00 PM UK
PMI Manufacturing
Value
Sep
56.90
56.20
Oct 02, 2017
6:30 AM China
PMI Manufacturing
Value
Sep
51.70
51.60
1:25 PM Germany
PMI Manufacturing
Value
Sep F
60.60
Oct 04, 2017
1:25 PM Germany
PMI Services
Value
Sep F
55.60
2:30 PM India
RBI Reverse Re po rate
%
Oct 4
5.75
5.75
2:30 PM India
RBI Repo rate
%
Oct 4
6.00
6.00
2:30 PM India
RBI Cash Reserve ratio
%
Oct 4
4.00
4.00
Oct 06, 2017
6:00 PM US
Change in N onfarm payrolls
Thousands
Sep
156.00
70.00
6:00 PM US
Unnemployment rate
%
Sep
4.40
4.40
Oct 10, 2017
India
Imports YoY%
% Change
Sep
21.00
India
Exports YoY%
% Change
Sep
10.30
2:00 PM UK
Industrial Production (YoY)
% Change
Aug
0.40
Oct 12, 2017
5:30 PM India
Industrial Production YoY
% Change
Aug
1.20
US
Producer Price Index (mom)
% Change
Sep
0.50
Oct 13, 2017
6:00 PM US
Consumer price index (mom)
% Change
Sep
0.40
0.50
China
Exports YoY%
% Change
Sep
5.60
Oct 16, 2017
12: 00 PM India
Monthly Wholesale Prices YoY%
% Change
Sep
3.24
7:00 AM China
Consumer Price Index (YoY)
% Change
Sep
1.80
Oct 17, 2017
2:30 PM Euro Zone
Euro-Zone CPI (YoY)
%
Sep F
1.50
6:45 PM US
Industrial Production
%
Sep
(0.90)
2:00 PM UK
CPI (YoY)
% Change
Sep
2.90
Oct 18, 2017
6:00 PM US
Housi ng Starts
Thousands
Sep
1,180.00
Source: Bloomberg, Angel Research
Market Outlook
September 29, 2017
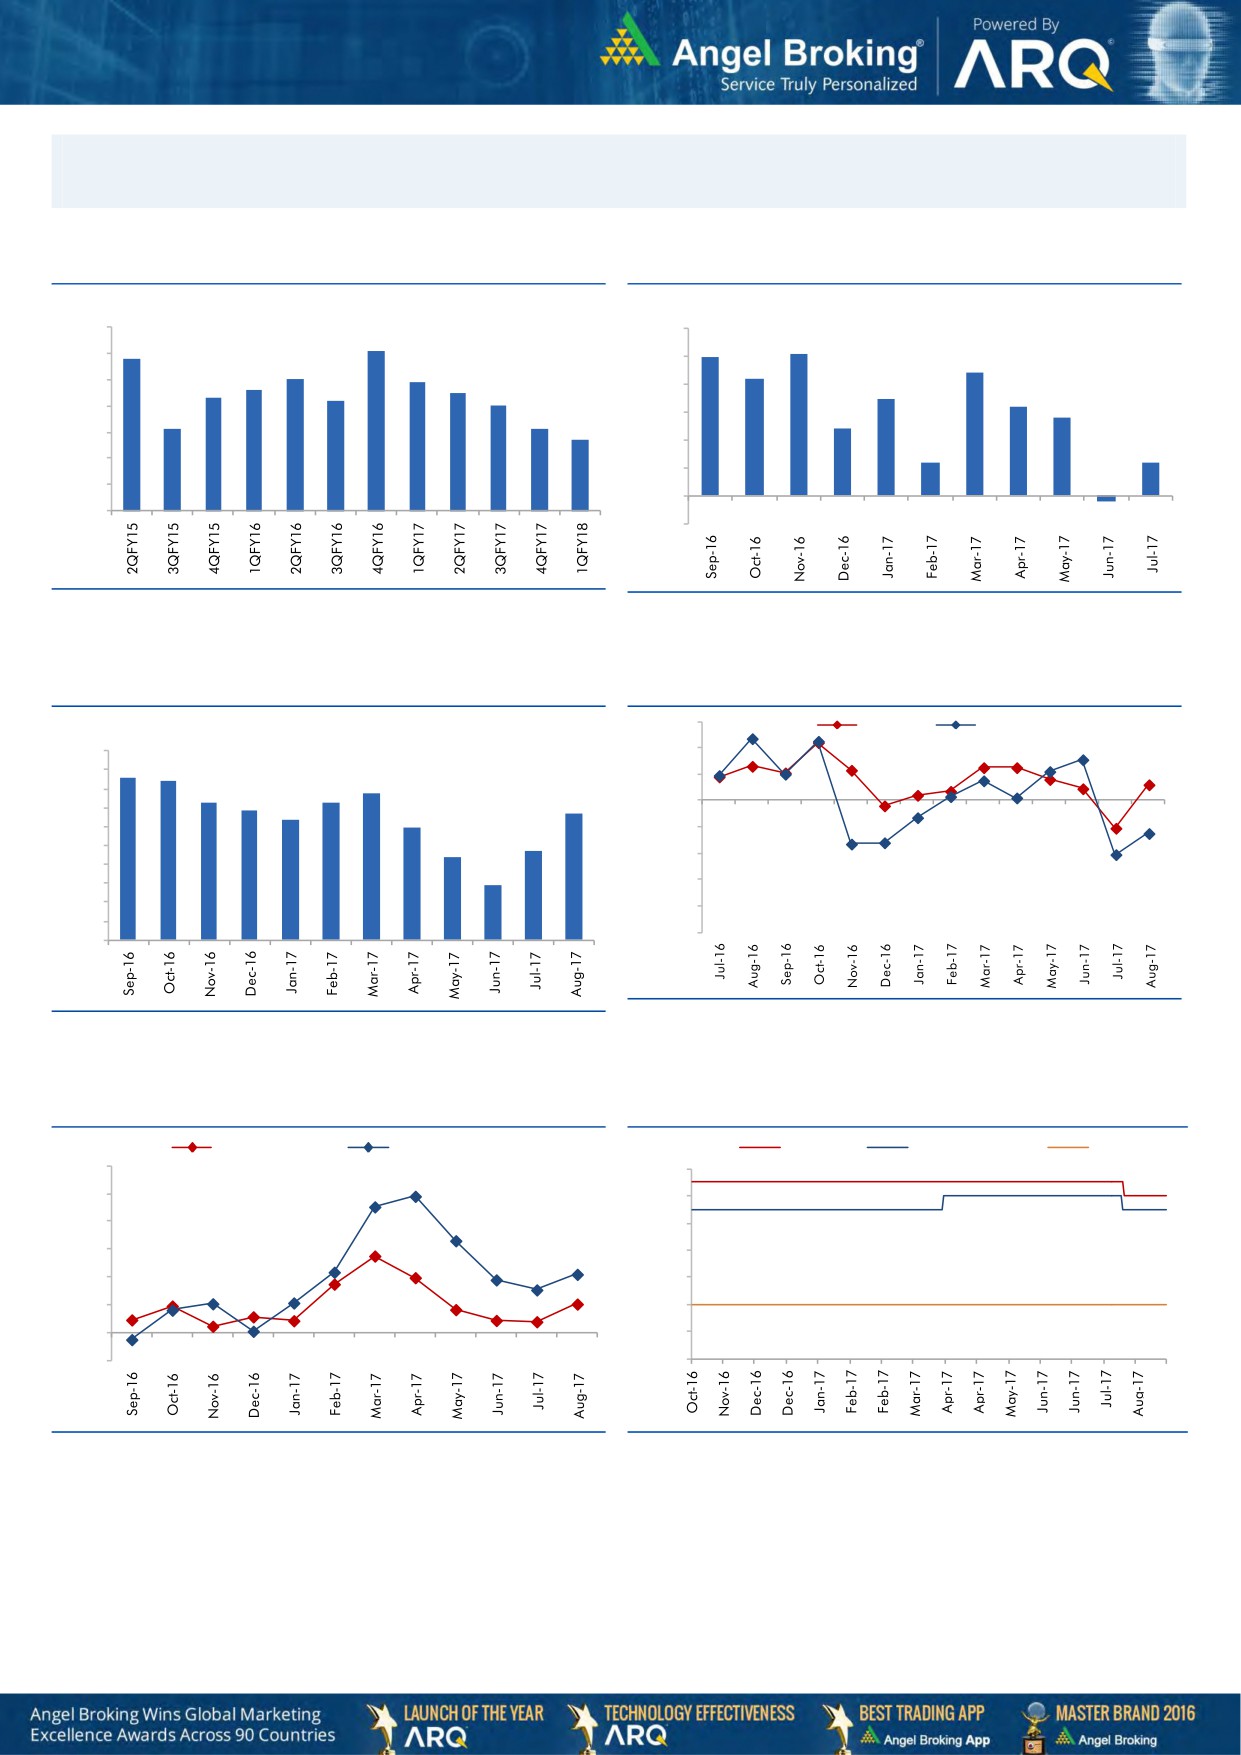
Macro watch
Exhibit 1: Quarterly GDP trends
Exhibit 2: IIP trends
(%)
(%)
10.0
6.0
9.1
5.1
8.8
5.0
9.0
5.0
4.4
8.0
7.9
4.2
7.6
7.5
8.0
7.3
7.2
4.0
3.5
7.0
3.2
2.8
7.0
6.1
6.1
3.0
2.4
5.7
6.0
2.0
1.2
1.2
5.0
1.0
4.0
-
3.0
(1.0)
(0.2)
Source: CSO, Angel Research
Source: MOSPI, Angel Research
Exhibit 3: Monthly CPI inflation trends
Exhibit 4: Manufacturing and services PMI
56.0
Mfg. PMI
Services PMI
(%)
5.0
54.0
4.3
4.2
4.5
3.9
52.0
4.0
3.6
3.7
3.4
3.4
3.2
50.0
3.5
3.0
3.0
48.0
2.4
2.2
2.5
46.0
2.0
1.5
1.5
44.0
1.0
42.0
0.5
40.0
-
Source: Market, Angel Research; Note: Level above 50 indicates expansion
Source: MOSPI, Angel Research
Exhibit 5: Exports and imports growth trends
Exhibit 6: Key policy rates
(%)
Exports yoy growth
Imports yoy growth
(%)
Repo rate
Reverse Repo rate
CRR
60.0
6.50
50.0
6.00
40.0
5.50
30.0
5.00
20.0
4.50
10.0
4.00
0.0
3.50
(10.0)
3.00
Source: Bloomberg, Angel Research
Source: RBI, Angel Research
Market Outlook
September 29, 2017
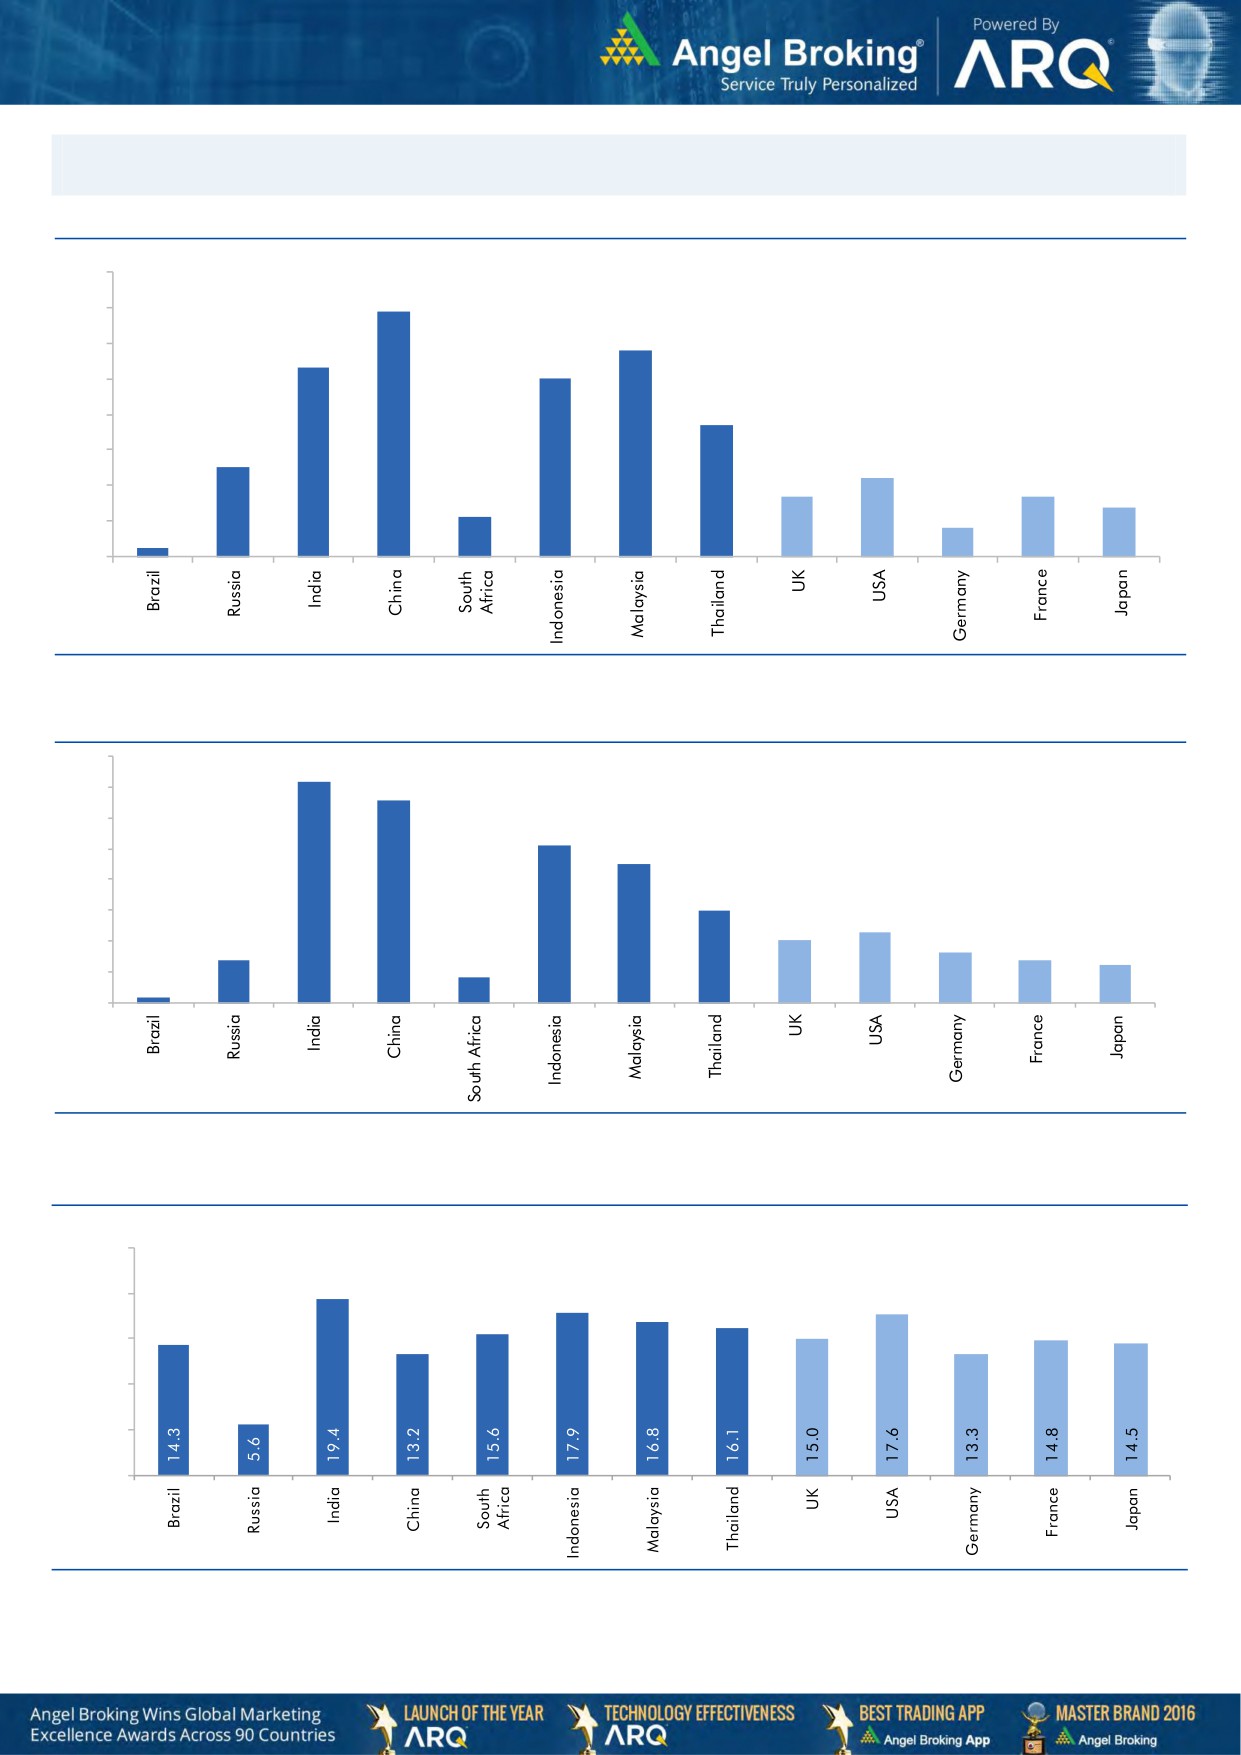
Global watch
Exhibit 1: Latest quarterly GDP Growth (%, yoy) across select developing and developed countries
(%)
8.0
6.9
7.0
5.8
6.0
5.3
5.0
5.0
1.1
3.7
4.0
2.5
3.0
2.2
1.7
1.7
2.0
1.4
0.8
1.0
0.3
-
Source: Bloomberg, Angel Research
Exhibit 2: 2017 GDP Growth projection by IMF (%, yoy) across select developing and developed countries
(%)
7.2
6.6
7.0
6.0
5.1
5.0
4.5
4.0
3.0
3.0
2.3
2.0
1.4
1.6
2.0
1.4
1.2
0.2
0.8
1.0
-
Source: IMF, Angel Research
Exhibit 3: One year forward P-E ratio across select developing and developed countries
(x)
25.0
20.0
15.0
10.0
5.0
-
Source: IMF, Angel Research, data as of 28th Sept-17
Market Outlook
September 29, 2017
Exhibit 4: Relative performance of indices across globe
Returns (%)
C ountry
Name of index
Closing price
1M
3M
1YR
Brazil
Bovespa
73,567
3.6
18.2
26.7
Russia
Micex
2,072
4.1
10.2
4.7
India
Nifty
9,769
(0.3)
2.9
12.0
China
Shanghai Composite
3,340
(0.3)
4.9
10.8
South Africa
Top 40
48,843
(2.4)
7.3
8.6
Mexico
Mexbol
50,137
(2.3)
0.6
6.1
Indonesia
LQ45
969
(0.9)
0.1
10.7
Malaysia
KLCI
1,758
(0.8)
(1.1)
6.2
Thailand
SET 50
1,066
3.0
6.7
10.9
USA
Dow Jones
22,381
2.6
4.3
23.4
UK
FTSE
7,323
(0.2)
(0.4)
6.1
Japan
Nikkei
20,363
4.7
0.7
21.2
Germany
DAX
12,705
6.4
3.1
20.0
France
CAC
5,294
5.2
3.4
18.2
Source: Bloomberg, Angel Research, data as of 28th Sept-17 p68in4
Stock Watch
September 29, 2017
Company Name
Reco
CMP
Target
Mkt Cap
Sales ( Čcr )
OPM(%)
EPS (Č)
PER(x)
P/BV(x)
RoE(%)
EV/Sales(x)
(Č)
Price ( Č)
( Č cr )
FY18E FY19E
FY18E
FY19E
FY18E
FY19E
FY18E
FY19E
FY18E
FY19E
FY18E
FY19E
FY18E
FY19E
Agri / Agri Chemical
Rallis
Neutral
206
-
4,007
1,873
2,099
15.0
15.0
9.5
10.5
21.7
19.6
3.3
3.0
15.8
16.0
2.0
1.8
United Phosphorus
Accumulate
766
820
38,921
18,922
21,949
18.0
18.5
36.2
45.6
21.2
16.8
4.4
3.7
22.7
23.8
2.2
1.9
Auto & Auto Ancillary
Ashok Leyland
Accumulate
117
127
34,211
23,339
27,240
10.1
10.8
4.7
6.2
25.2
18.8
5.0
4.4
20.0
23.6
1.4
1.2
Bajaj Auto
Neutral
3,034
-
87,797
23,936
27,955
19.5
20.1
142.7
167.3
21.3
18.1
4.6
4.1
21.8
22.8
3.3
2.7
Bharat Forge
Buy
600
875
27,926
7,637
8,755
21.7
23.2
36.1
47.3
16.6
12.7
3.0
2.5
18.5
20.8
3.5
3.0
Eicher Motors
Neutral
30,168
-
82,126
19,043
22,837
19.5
19.9
835.4
1,019.0
36.1
29.6
13.5
10.4
40.9
37.8
4.2
3.4
Gabriel India
Neutral
195
-
2,798
1,782
2,033
9.7
10.2
7.1
8.9
27.4
22.0
5.5
4.7
21.0
22.2
1.5
1.3
Hero Motocorp
Accumulate
3,745
4,129
74,777
32,239
36,878
16.0
15.6
184.4
206.5
20.3
18.1
6.4
5.6
31.3
30.7
2.1
1.8
Jamna Auto Industries Neutral
256
-
2,036
1,441
1,662
14.4
14.8
13.9
17.6
18.4
14.5
5.0
4.1
30.0
31.0
1.4
1.2
Mahindra and Mahindra Neutral
1,235
-
76,683
46,971
53,816
13.6
14.0
67.7
79.8
18.2
15.5
2.6
2.3
15.0
15.9
1.5
1.3
Maruti
Accumulate
7,897
8,658
238,557
81,825
101,245
15.0
15.0
283.5
356.0
27.9
22.2
6.1
5.0
21.9
22.4
2.6
2.0
Minda Industries
Neutral
838
-
7,239
4,328
5,084
11.0
11.9
27.3
36.4
30.7
23.0
6.5
5.1
23.1
25.6
1.8
1.5
Motherson Sumi
Neutral
339
-
71,270
55,937
64,445
10.8
11.4
16.9
21.1
20.0
16.1
4.5
4.6
25.2
25.4
1.3
1.1
Tata Motors
Neutral
401
-
115,812
303,167
343,649
11.8
13.8
33.1
54.7
12.1
7.3
2.0
1.6
16.9
23.0
0.4
0.4
TVS Motor
Neutral
644
-
30,596
13,992
16,216
9.0
9.4
17.1
20.3
37.8
31.7
10.0
7.8
29.7
27.7
2.1
1.8
Amara Raja Batteries
Buy
710
858
12,123
6,140
7,122
14.3
15.6
29.3
39.0
24.2
18.2
4.1
3.5
17.1
19.0
2.0
1.7
Exide Industries
Neutral
203
-
17,259
8,689
9,854
15.1
15.2
9.7
11.0
21.0
18.5
3.7
3.3
15.7
16.1
1.7
1.5
Apollo Tyres
Neutral
243
-
12,369
15,739
17,326
13.3
14.6
20.4
26.7
11.9
9.1
1.4
1.3
20.4
26.7
1.0
0.9
Ceat
Neutral
1,693
-
6,849
6,661
7,717
11.1
14.2
116.2
178.2
14.6
9.5
2.5
2.1
15.2
21.3
1.1
1.0
JK Tyres
Neutral
146
-
3,302
8,318
9,239
16.2
16.4
21.0
27.5
7.0
5.3
1.4
1.1
19.1
20.4
0.8
0.7
Swaraj Engines
Neutral
1,992
-
2,474
788
889
16.4
16.5
71.6
81.0
27.8
24.6
8.0
7.5
29.6
31.0
2.8
2.4
Subros
Neutral
238
-
1,430
1,855
2,135
11.6
11.8
10.3
14.7
23.3
16.3
3.5
3.0
15.8
19.1
1.0
0.8
Capital Goods
BEML
Neutral
1,645
-
6,849
4,286
5,194
7.1
8.2
42.9
58.1
38.3
28.3
3.1
2.9
7.6
8.7
1.7
1.3
Bharat Electronics
Neutral
164
-
40,258
10,258
12,470
19.6
19.5
7.3
8.6
22.5
19.1
0.4
0.4
20.4
21.9
3.4
2.8
Voltas
Neutral
501
-
16,581
6,778
8,004
9.6
11.0
17.1
22.4
29.3
22.4
7.0
6.1
17.7
19.8
2.1
1.8
BHEL
Neutral
83
-
30,436
33,200
39,167
6.8
9.5
6.2
11.2
13.4
7.4
0.6
0.6
4.6
8.0
0.5
0.4
Blue Star
Accumulate
751
850
7,191
5,220
6,207
6.3
6.6
16.8
22.3
44.7
33.7
8.9
7.8
19.9
23.3
1.3
1.1
CG Power and Industrial
Neutral
77
-
4,807
6,555
7,292
7.5
7.5
-
0.8
7,670.0
95.9
1.2
1.2
0.1
1.2
0.8
0.7
Solutions
Greaves Cotton
Neutral
137
-
3,341
1,778
1,993
14.7
15.1
8.1
9.1
16.9
15.0
3.8
3.5
21.8
23.6
1.6
1.5
Stock Watch
September 29, 2017
Company Name
Reco
CMP
Target
Mkt Cap
Sales ( Čcr )
OPM(%)
EPS (Č)
PER(x)
P/BV(x)
RoE(%)
EV/Sales(x)
(Č)
Price ( Č)
( Č cr )
FY18E FY19E
FY18E
FY19E
FY18E
FY19E
FY18E
FY19E
FY18E
FY19E
FY18E
FY19E
FY18E
FY19E
Capital Goods
KEC International
Accumulate
306
350
7,871
9,779
11,113
9.4
9.8
14.2
18.2
21.6
16.8
4.1
3.4
21.1
22.1
1.1
0.9
KEI Industries
Buy
319
371
2,481
3,001
3,391
10.0
10.0
13.0
16.1
24.5
19.8
4.5
3.7
18.2
18.7
1.0
0.9
Thermax
Neutral
904
-
10,774
4,125
4,747
10.3
10.8
26.7
31.5
33.9
28.7
3.8
3.5
11.2
12.0
2.3
2.0
VATech Wabag
Buy
592
681
3,232
3,867
4,126
9.6
10.0
34.9
39.8
17.0
14.9
2.8
2.4
17.7
17.5
0.9
0.8
Cement
ACC
Neutral
1,650
-
30,986
12,255
13,350
13.5
14.3
58.0
66.2
28.5
24.9
3.4
3.1
11.5
12.2
2.5
2.3
Ambuja Cements
Neutral
268
-
53,235
10,250
11,450
17.5
19.0
7.2
8.3
37.2
32.3
2.7
2.5
7.0
7.8
5.0
4.4
India Cements
Neutral
171
-
5,254
6,135
6,750
14.8
15.2
8.5
11.5
20.1
14.8
1.0
0.9
4.8
6.2
1.2
1.0
JK Cement
Neutral
952
-
6,655
4,150
4,775
19.2
20.0
49.0
63.5
19.4
15.0
3.1
2.6
17.0
18.5
2.0
1.7
J K Lakshmi Cement
Neutral
386
-
4,546
3,422
3,757
15.5
17.0
13.5
23.2
28.6
16.7
3.0
2.6
10.8
15.5
1.7
1.5
Orient Cement
Neutral
151
-
3,088
2,215
3,233
16.8
17.0
5.9
6.9
25.6
21.9
2.0
1.8
10.8
10.1
2.4
1.6
UltraTech Cement
Neutral
3,862
-
106,037
28,250
35,150
20.2
23.5
77.5
122.2
49.8
31.6
4.2
3.8
9.6
14.8
4.2
3.4
Construction
KNR Constructions
Neutral
206
-
2,901
1,846
2,203
14.5
14.5
12.1
13.7
17.1
15.1
0.9
0.8
17.5
16.7
1.6
1.3
Larsen & Toubro
Neutral
1,133
-
158,661
95,787
109,476
10.2
11.6
44.5
50.8
25.5
22.3
3.2
2.9
12.9
13.1
2.2
2.0
Gujarat Pipavav Port
Neutral
137
-
6,633
739
842
61.6
62.7
5.1
6.2
26.9
22.3
3.4
3.3
12.7
14.9
8.4
7.3
PNC Infratech
Neutral
140
-
3,602
2,040
2,935
13.0
13.0
6.4
9.0
21.9
15.6
0.6
0.5
9.7
12.2
1.8
1.3
Simplex Infra
Neutral
458
-
2,266
6,012
6,619
11.6
11.7
21.1
31.0
21.8
14.8
1.5
1.4
6.5
8.6
0.9
0.8
Sadbhav Engineering
Neutral
291
-
4,986
3,823
4,426
10.7
10.8
10.3
11.8
28.2
24.6
3.4
3.0
10.1
10.5
1.6
1.4
NBCC
Neutral
211
-
18,954
9,099
12,706
6.4
6.4
7.3
9.6
28.9
22.0
1.3
1.0
27.5
30.5
1.9
1.4
MEP Infra
Neutral
97
-
1,572
2,403
2,910
18.3
16.8
2.4
6.1
41.1
15.9
15.6
10.5
35.2
55.8
1.8
1.5
SIPL
Neutral
100
-
3,508
2,060
2,390
46.8
47.7
(5.8)
(3.1)
3.7
4.3
(14.2)
(2.3)
6.5
6.0
Engineers India
Neutral
149
-
10,017
1,795
2,611
21.1
22.4
5.9
8.1
25.2
18.4
1.8
1.7
12.9
16.1
4.0
2.6
Financials
Axis Bank
Accumulate
512
580
122,697
32,558
35,843
3.5
3.2
27.8
41.0
18.4
12.5
2.0
1.8
11.4
14.9
-
-
Bank of Baroda
Neutral
139
-
32,005
22,533
26,079
2.4
2.4
12.0
20.9
11.6
6.7
0.8
0.7
6.6
11.0
-
-
Canara Bank
Neutral
316
-
18,886
17,925
20,235
2.0
2.1
18.5
36.5
17.1
8.7
0.7
0.6
3.4
6.2
-
-
Can Fin Homes
Neutral
2,636
-
7,016
586
741
3.5
3.5
107.8
141.0
24.4
18.7
5.4
4.3
24.1
25.6
-
-
Cholamandalam Inv. &
Accumulate
1,084
1,230
16,946
2,826
3,307
6.3
6.3
53.7
64.6
20.2
16.8
3.4
2.9
18.3
18.9
-
-
Fin. Co.
Dewan Housing Finance Accumulate
534
610
16,755
2,676
3,383
2.4
2.7
37.4
49.7
14.3
10.8
1.9
1.6
13.8
16.2
-
-
Equitas Holdings
Buy
152
235
5,148
1,125
1,380
9.6
9.8
1.5
6.0
101.3
25.3
2.3
2.1
2.4
8.2
-
-
Federal Bank
Accumulate
111
125
21,671
4,896
5,930
2.8
3.1
5.4
7.6
20.7
14.7
1.8
1.6
8.5
11.0
-
-
Stock Watch
September 29, 2017
Company Name
Reco
CMP
Target
Mkt Cap
Sales ( Čcr )
OPM(%)
EPS (Č)
PER(x)
P/BV(x)
RoE(%)
EV/Sales(x)
(Č)
Price ( Č)
( Č cr )
FY18E FY19E
FY18E
FY19E
FY18E
FY19E
FY18E
FY19E
FY18E
FY19E
FY18E
FY19E
FY18E
FY19E
Financials
GIC Housing
Buy
518
655
2,791
376
477
3.6
3.7
33.0
40.0
15.7
13.0
2.8
2.4
20.0
23.0
-
-
HDFC Bank
Neutral
1,795
-
463,257
55,236
63,253
4.5
4.4
68.9
82.4
26.1
21.8
4.5
3.8
18.7
18.5
-
-
ICICI Bank
Accumulate
276
315
176,797
42,361
51,378
3.6
3.9
18.4
25.7
15.0
10.7
1.6
1.6
11.3
15.0
-
-
Karur Vysya Bank
Buy
143
180
8,633
3,289
3,630
3.7
3.9
10.8
14.1
13.2
10.2
1.6
1.4
12.5
14.7
-
-
LIC Housing Finance
Neutral
624
-
31,509
4,895
6,332
3.4
3.7
50.7
66.8
12.3
9.4
2.5
2.0
21.7
23.8
-
-
Punjab Natl.Bank
Neutral
131
-
27,908
23,708
25,758
2.1
2.1
5.9
16.4
22.3
8.0
0.7
0.6
3.0
8.3
-
-
RBL Bank
Neutral
503
-
20,799
2,309
2,888
2.6
2.5
16.4
19.1
30.8
26.4
3.9
3.4
13.3
13.8
-
-
Repco Home Finance
Buy
616
825
3,851
496
597
4.4
4.2
38.5
48.7
16.0
12.6
2.9
2.4
19.6
20.6
-
-
South Ind.Bank
Neutral
28
-
5,034
3,195
3,567
3.0
3.1
3.0
3.8
9.2
7.3
0.9
0.8
10.5
11.9
-
-
St Bk of India
Neutral
253
-
218,218
105,827
121,056
2.4
2.5
16.1
25.6
15.7
9.9
1.2
1.1
6.6
9.9
-
-
Union Bank
Neutral
129
-
9,335
14,650
16,225
2.3
2.3
23.1
32.5
5.6
4.0
0.4
0.4
7.1
9.2
-
-
Yes Bank
Neutral
351
-
80,338
11,088
13,138
3.0
2.9
84.0
99.3
4.2
3.5
0.6
0.6
16.3
16.8
-
-
FMCG
Akzo Nobel India
Neutral
1,881
-
9,022
3,164
3,607
13.8
13.7
58.6
67.9
32.1
27.7
7.9
7.0
24.5
25.1
2.7
2.4
Asian Paints
Neutral
1,129
-
108,317
17,603
20,615
18.6
18.6
2,128.9
2,543.3
0.5
0.4
11.2
9.4
28.0
28.9
6.0
5.0
Britannia
Neutral
4,345
-
52,163
9,690
11,278
14.8
15.4
84.0
101.0
51.7
43.0
18.9
15.0
40.6
39.0
5.3
4.6
Colgate
Neutral
1,073
-
29,181
4,420
5,074
24.9
25.3
28.6
32.8
37.5
32.7
14.8
12.0
43.8
40.5
6.4
5.5
Dabur India
Neutral
311
-
54,827
8,346
9,344
19.6
19.9
7.8
9.0
39.9
34.6
8.0
7.3
25.2
24.8
6.2
5.4
GlaxoSmith Con*
Neutral
4,922
-
20,701
5,072
5,760
18.2
18.4
176.3
199.2
27.9
24.7
5.9
5.4
21.2
21.7
3.4
2.9
Godrej Consumer
Neutral
902
-
61,459
10,171
11,682
20.8
21.5
21.7
27.1
41.6
33.3
9.4
8.0
22.3
23.4
6.2
5.3
HUL
Neutral
1,204
-
260,538
37,077
41,508
20.3
21.8
5,189.9
6,318.5
0.2
0.2
36.7
31.4
74.8
82.0
6.9
6.1
ITC
Neutral
261
-
318,089
44,588
49,853
37.0
37.3
9.6
11.0
27.2
23.7
6.7
6.4
25.1
27.3
6.6
5.9
Marico
Neutral
311
-
40,134
6,788
7,766
18.5
19.2
7.1
8.5
43.8
36.6
15.3
13.1
36.9
38.0
5.8
5.0
Nestle*
Neutral
7,155
-
68,985
10,083
11,182
20.0
20.9
119.7
141.3
59.8
50.6
210.7
192.5
36.7
39.8
6.5
5.8
Tata Global
Neutral
203
-
12,821
7,121
7,641
11.9
12.3
6.9
8.0
29.4
25.4
2.0
1.9
6.8
7.2
1.6
1.5
Procter & Gamble
Neutral
8,366
-
27,158
3,034
3,579
27.1
27.7
167.7
198.8
49.9
42.1
13.4
11.5
28.8
29.5
8.4
7.0
Hygiene
IT
HCL Tech^
Buy
873
1,014
124,597
52,342
57,053
20.9
20.9
62.8
67.6
13.9
12.9
3.1
2.7
22.4
20.6
2.1
1.8
Infosys
Buy
896
1,179
205,739
73,963
80,619
26.0
26.0
64.4
69.3
13.9
12.9
2.7
2.5
19.7
19.6
2.2
2.0
TCS
Accumulate
2,478
2,651
488,361
127,403
138,870
27.6
27.6
144.5
156.0
17.2
15.9
5.1
4.7
29.7
29.8
3.5
3.2
Tech Mahindra
Buy
453
533
44,247
31,015
33,496
15.0
15.0
35.6
38.1
12.7
11.9
2.2
2.0
17.0
16.3
1.2
1.0
Stock Watch
September 29, 2017
Company Name
Reco
CMP
Target
Mkt Cap
Sales ( Čcr )
OPM(%)
EPS (Č)
PER(x)
P/BV(x)
RoE(%)
EV/Sales(x)
(Č)
Price ( Č)
( Č cr )
FY18E FY19E
FY18E
FY19E
FY18E
FY19E
FY18E
FY19E
FY18E
FY19E
FY18E
FY19E
FY18E
FY19E
IT
Wipro
Neutral
286
-
139,114
58,536
61,858
20.3
20.3
18.2
19.1
15.7
15.0
2.4
2.1
14.6
13.4
2.3
2.2
Media
D B Corp
Neutral
369
-
6,788
2,404
2,625
30.5
31.5
23.7
26.9
15.6
13.7
3.7
3.1
23.5
22.8
2.7
2.4
HT Media
Neutral
93
-
2,174
2,589
2,830
15.1
15.4
8.3
10.9
11.3
8.6
0.9
0.8
8.4
10.4
0.4
0.3
Jagran Prakashan
Buy
180
225
5,880
2,541
2,835
28.5
28.7
12.7
14.1
14.2
12.8
2.9
2.5
21.3
21.4
2.2
1.9
Sun TV Network
Neutral
737
-
29,044
3,238
3,789
51.9
55.1
30.9
38.0
23.9
19.4
6.8
6.0
30.0
31.0
8.5
7.1
Hindustan Media
Neutral
253
-
1,855
1,002
1,074
23.3
23.5
29.2
33.8
8.7
7.5
1.4
1.2
15.6
15.4
0.9
0.6
Ventures
TV Today Network
Buy
351
435
2,095
667
727
27.7
27.7
18.6
20.1
18.9
17.5
2.9
3.0
15.6
17.3
2.7
2.5
Music Broadcast Limited Buy
377
434
2,148
271
317
91.0
109.0
6.0
10.0
62.8
37.7
3.9
3.6
6.5
9.3
7.5
6.2
Metals & Mining
Coal India
Neutral
267
-
165,738
82,301
91,235
17.0
18.0
17.1
20.5
15.6
13.0
2.9
2.8
45.0
55.0
1.7
1.5
Hind. Zinc
Neutral
292
-
123,548
22,108
24,555
57.0
58.0
22.1
26.3
13.2
11.1
4.3
3.5
32.0
35.0
4.6
3.8
Hindalco
Neutral
238
-
53,499
102,350
105,355
13.5
14.5
21.5
24.5
11.1
9.7
1.5
1.3
15.0
15.2
1.1
1.0
JSW Steel
Neutral
239
-
57,747
64,500
68,245
21.1
21.5
20.1
21.2
11.9
11.3
2.2
1.9
-
-
1.6
1.6
NMDC
Neutral
117
-
37,128
10,209
11,450
47.0
48.0
11.1
12.1
10.6
9.7
1.5
1.4
-
-
3.2
2.9
SAIL
Neutral
53
-
22,013
54,100
63,555
3.0
10.0
(10.0)
1.5
35.5
0.7
0.7
-
-
1.4
1.2
Vedanta
Neutral
309
-
114,824
81,206
87,345
28.0
29.0
26.5
33.5
11.7
9.2
2.7
2.3
-
-
2.2
1.9
Tata Steel
Neutral
650
-
63,124
121,445
126,500
16.2
17.2
65.4
81.3
9.9
8.0
1.6
1.4
-
-
1.0
0.9
Oil & Gas
GAIL
Neutral
396
-
67,001
53,115
52,344
14.2
15.3
30.0
31.1
13.2
12.7
1.7
1.5
-
-
1.0
1.0
ONGC
Neutral
172
-
220,796
83,111
84,934
44.2
44.9
16.4
16.9
10.5
10.2
1.3
1.2
-
-
2.5
2.5
Indian Oil Corp
Neutral
397
-
192,974
396,116
432,560
8.5
8.8
40.1
42.2
9.9
9.4
1.7
1.5
-
-
0.6
0.6
Reliance Industries
Neutral
787
-
511,687
257,711
267,438
17.0
18.2
89.1
89.5
8.8
8.8
0.8
0.8
-
-
1.6
1.6
Pharmaceuticals
Alembic Pharma
Buy
498
600
9,392
3,903
4,584
18.2
19.2
21.8
27.2
22.9
18.3
4.2
3.5
19.8
20.6
2.4
2.1
Alkem Laboratories Ltd
Accumulate
1,865
2,079
22,298
6,320
7,341
17.5
19.8
72.7
96.6
25.7
19.3
4.5
3.8
16.7
18.7
3.5
2.9
Aurobindo Pharma
Buy
676
823
39,612
17,086
19,478
22.1
22.0
44.7
51.4
15.1
13.2
3.4
2.7
24.7
22.7
2.4
2.1
Aventis*
Neutral
4,065
-
9,362
2,508
2,862
16.8
16.8
139.9
153.8
29.1
26.4
4.2
3.4
23.5
25.8
3.3
2.7
Cadila Healthcare
Reduce
467
426
47,824
11,584
13,228
20.3
20.4
18.7
21.3
25.0
21.9
5.6
4.6
24.6
22.9
4.0
3.4
Cipla
Sell
582
458
46,792
16,619
19,437
15.4
16.2
19.7
24.3
29.5
23.9
3.4
3.0
12.0
13.2
3.0
2.5
Dr Reddy's
Neutral
2,368
-
39,257
15,844
17,973
17.6
18.2
91.7
111.0
25.8
21.3
2.9
2.7
11.9
13.0
2.7
2.4
GSK Pharma*
Neutral
2,444
-
20,698
3,260
3,651
15.0
18.0
46.1
58.6
53.0
41.7
10.9
11.2
20.0
26.5
6.2
5.7
Indoco Remedies
Sell
207
153
1,911
1,154
1,310
14.9
14.9
11.3
12.7
18.4
16.3
2.6
2.3
15.0
15.0
1.8
1.5
Stock Watch
September 29, 2017
Company Name
Reco
CMP
Target
Mkt Cap
Sales ( Čcr )
OPM(%)
EPS (Č)
PER(x)
P/BV(x)
RoE(%)
EV/Sales(x)
(Č)
Price ( Č)
( Č cr )
FY18E FY19E
FY18E
FY19E
FY18E
FY19E
FY18E
FY19E
FY18E
FY19E
FY18E
FY19E
FY18E
FY19E
Pharmaceuticals
Ipca labs
Accumulate
502
540
6,328
3,593
4,022
14.5
15.5
19.4
25.2
25.9
19.9
2.4
2.1
9.5
11.2
1.8
1.6
Lupin
Buy
1,005
1,467
45,406
18,657
21,289
21.3
23.3
52.8
66.7
19.0
15.1
2.9
2.4
16.3
17.5
2.4
2.0
Natco Pharma
Neutral
787
-
13,726
1,836
1,946
31.8
28.9
22.1
20.6
35.6
38.2
7.2
6.4
20.1
16.7
7.3
6.9
Sun Pharma
Accumulate
501
558
120,178
32,899
36,451
26.9
25.4
31.6
32.3
15.9
15.5
2.8
2.4
18.7
18.8
3.3
2.8
Syngene International
Accumulate
493
557
9,855
1,402
1,823
32.8
36.0
15.9
20.7
31.0
23.9
5.8
4.8
18.7
20.0
7.0
5.4
Power
Tata Power
Neutral
77
-
20,894
32,547
33,806
20.5
20.5
4.7
5.4
16.4
14.4
1.6
1.4
10.5
10.5
1.6
1.6
NTPC
Neutral
166
-
136,627
86,070
101,246
28.3
30.7
12.9
16.2
12.8
10.2
1.3
1.2
10.6
12.4
3.0
2.6
Power Grid
Accumulate
209
223
109,497
29,183
32,946
89.7
90.0
18.0
20.8
11.7
10.1
1.9
1.7
17.7
18.2
7.7
7.1
Real Estate
Prestige Estate
Neutral
269
-
10,082
4,607
5,146
21.0
22.2
7.9
9.8
34.0
27.4
2.1
1.9
10.3
12.0
3.4
3.1
MLIFE
Accumulate
463
522
2,376
487
590
12.3
17.8
21.0
31.2
22.0
14.8
1.2
1.1
5.2
7.4
3.6
2.9
Telecom
Bharti Airtel
Neutral
382
-
152,861
97,903
105,233
36.0
36.3
9.3
11.1
41.1
34.6
2.0
1.9
5.0
5.6
2.5
2.3
Idea Cellular
Neutral
76
-
27,250
35,012
37,689
27.1
27.7
(4.4)
(2.7)
1.2
1.2
(6.8)
(4.6)
2.1
1.9
zOthers
Abbott India
Neutral
4,109
-
8,731
3,244
3,723
14.9
16.1
167.5
209.4
24.5
19.6
5.4
4.5
23.7
24.8
2.3
2.0
Asian Granito
Buy
467
570
1,405
1,169
1,286
12.5
12.5
16.0
19.7
29.2
23.7
3.1
2.8
10.7
11.6
1.4
1.3
Bajaj Electricals
Accumulate
357
395
3,629
4,646
5,301
6.7
7.6
16.1
22.3
22.2
16.0
3.6
3.1
16.4
19.2
0.8
0.7
Banco Products (India)
Neutral
207
-
1,477
1,530
1,695
13.2
12.7
19.0
20.0
10.9
10.3
1.7
1.5
0.2
0.2
0.9
97.0
Coffee Day Enterprises
Neutral
208
-
4,279
3,494
3,913
17.4
18.0
4.8
5.7
-
36.5
1.8
1.8
-
0.1
1.7
1.5
Ltd
Elecon Engineering
Neutral
54
-
607
171
201
15.0
16.2
36.0
43.0
1.5
1.3
0.1
0.1
0.1
0.1
2.9
2.5
Garware Wall Ropes
Neutral
884
-
1,934
928
1,003
15.2
15.2
39.4
43.2
22.4
20.5
3.7
3.2
16.5
15.4
2.0
1.7
Goodyear India*
Neutral
820
-
1,892
1,717
1,866
11.8
12.3
47.9
49.8
17.1
16.5
2.6
2.3
15.6
15.7
0.8
114.1
Hitachi
Neutral
2,021
-
5,495
2,355
2,715
10.3
10.8
49.0
60.9
41.2
33.2
9.7
7.6
0.2
0.2
2.4
2.0
HSIL
Neutral
386
-
2,794
2,240
2,670
14.6
15.0
17.0
22.0
22.7
17.6
1.9
1.8
0.1
0.1
1.5
1.2
Interglobe Aviation
Neutral
1,078
-
38,979
22,570
27,955
14.2
15.0
63.6
81.8
17.0
13.2
8.9
7.5
0.5
0.6
1.4
1.1
Jyothy Laboratories
Neutral
399
-
7,247
1,781
2,044
14.1
15.0
9.4
10.5
42.7
38.0
9.1
8.5
0.2
0.2
4.3
3.7
Linc Pen & Plastics
Neutral
224
-
332
420
462
9.3
9.3
15.3
17.1
14.7
13.1
2.5
2.6
16.9
19.5
0.8
0.8
M M Forgings
Neutral
616
-
744
542
642
20.1
21.0
41.6
56.8
14.8
10.9
2.0
1.7
0.1
0.2
1.8
1.6
Mirza International
Neutral
156
-
1,882
1,148
1,285
18.0
18.0
8.0
9.4
19.5
16.7
3.2
2.7
16.3
16.1
1.8
1.6
Navkar Corporation
Buy
182
265
2,593
561
617
41.5
41.5
11.5
12.7
15.8
14.3
1.7
1.5
10.5
10.4
5.3
4.6
Nilkamal
Neutral
1,546
-
2,307
2,317
2,525
11.4
11.1
96.0
105.0
16.1
14.7
2.7
2.4
0.2
0.2
1.0
0.9
Stock Watch
September 29, 2017
Company Name
Reco
CMP
Target Mkt Cap
Sales ( Čcr )
OPM(%)
EPS (Č)
PER(x)
P/BV(x)
RoE(%)
EV/Sales(x)
(Č)
Price ( Č)
( Č cr )
FY18E FY19E FY18E FY19E FY18E FY19E FY18E FY19E FY18E FY19E FY18E FY19E FY18E FY19E
zOthers
Parag Milk Foods
Neutral
233
-
1,959
1,987
2,379
7.6
9.0
12.4
18.3
18.8
12.7
2.6
2.3
8.2
13.2
1.1
0.9
Radico Khaitan
Neutral
158
-
2,102
1,811
1,992
13.2
13.2
8.1
8.8
19.5
17.9
2.0
2.2
10.1
12.0
1.5
1.4
Relaxo Footwears
Neutral
512
-
6,152
1,981
2,310
13.7
14.5
12.0
15.5
42.7
33.0
8.3
6.7
0.2
0.2
3.2
2.7
Siyaram Silk Mills
Buy
2,117
2,500
1,984
1,769
1,981
12.7
12.7
113.1
131.1
18.7
16.1
2.9
2.5
15.5
15.5
1.3
1.2
Styrolution ABS India* Neutral
845
-
1,486
1,800
1,980
8.0
8.1
42.0
46.2
20.1
18.3
2.3
2.0
0.1
0.1
0.9
0.9
Surya Roshni
Neutral
293
-
1,285
4,870
5,320
7.7
7.8
22.8
28.1
12.9
10.4
1.7
1.5
0.1
0.1
0.5
0.4
TVS Srichakra
Neutral
3,076
-
2,355
2,729
2,893
12.7
12.5
248.5
265.0
12.4
11.6
3.5
2.9
0.3
0.3
0.9
0.8
Visaka Industries
Neutral
572
-
909
1,104
1,214
12.1
12.6
31.0
37.9
18.5
15.1
2.3
2.0
0.1
0.1
1.1
0.9
VIP Industries
Buy
240
300
3,393
1,450
1,693
10.4
10.5
6.5
7.8
36.7
30.7
7.8
6.8
21.1
22.1
2.3
2.0
Navin Fluorine
Accumulate
665
730
3,278
945
1,154
22.4
22.6
28.7
34.8
23.2
19.1
3.8
3.3
-
-
3.0
2.3
Source: Company, Angel Research; Note: *December year end; #September year end; &October year end; Price as on September 28, 2017
Market Outlook
September 29, 2017
Research Team Tel: 022 - 39357800
DISCLAIMER
Angel Broking Private Limited (hereinafter referred to as “Angel”) is a registered Member of National Stock Exchange of India
Limited,Bombay Stock Exchange Limited and Metropolitan Stock Exchange Limited. It is also registered as a Depository Participant with
CDSL and Portfolio Manager with SEBI. It also has registration with AMFI as a Mutual Fund Distributor. Angel Broking Private Limited is a
registered entity with SEBI for Research Analyst in terms of SEBI (Research Analyst) Regulations, 2014 vide registration number
INH000000164. Angel or its associates has not been debarred/ suspended by SEBI or any other regulatory authority for accessing
/dealing in securities Market. Angel or its associates/analyst has not received any compensation / managed or
co-managed public offering of securities of the company covered by Analyst during the past twelve months.
This document is solely for the personal information of the recipient, and must not be singularly used as the basis of any investment
decision. Nothing in this document should be construed as investment or financial advice. Each recipient of this document should make
such investigations as they deem necessary to arrive at an independent evaluation of an investment in the securities of the companies
referred to in this document (including the merits and risks involved), and should consult their own advisors to determine the merits and
risks of such an investment.
Reports based on technical and derivative analysis center on studying charts of a stock's price movement, outstanding positions and
trading volume, as opposed to focusing on a company's fundamentals and, as such, may not match with a report on a company's
fundamentals. Investors are advised to refer the Fundamental and Technical Research Reports available on our website to evaluate the
contrary view, if any.
The information in this document has been printed on the basis of publicly available information, internal data and other reliable
sources believed to be true, but we do not represent that it is accurate or complete and it should not be relied on as such, as this
document is for general guidance only. Angel Broking Pvt. Limited or any of its affiliates/ group companies shall not be in any way
responsible for any loss or damage that may arise to any person from any inadvertent error in the information contained in this report.
Angel Broking Pvt. Limited has not independently verified all the information contained within this document. Accordingly, we cannot
testify, nor make any representation or warranty, express or implied, to the accuracy, contents or data contained within this document.
While Angel Broking Pvt. Limited endeavors to update on a reasonable basis the information discussed in this material, there may be
regulatory, compliance, or other reasons that prevent us from doing so.
This document is being supplied to you solely for your information, and its contents, information or data may not be reproduced,
redistributed or passed on, directly or indirectly.
Neither Angel Broking Pvt. Limited, nor its directors, employees or affiliates shall be liable for any loss or damage that may arise from
or in connection with the use of this information.